States with the Most Tornadoes

2. Kansas — 4,573 recorded tornado-state pairs
Kansas places second with 4,573 distinct year-tornado-state keys, or 61.0 per year as a simple window average. It is 170 records ahead of Oklahoma, the smallest gap among the top three states. Raw totals do not adjust for land area or changes in observation coverage.

3. Oklahoma — 4,403 recorded tornado-state pairs
Oklahoma's 4,403 records equal a simple 58.7-per-year average over the fixed window. The state trails Kansas by 170 and leads Florida by 670. Those differences are arithmetic from one consistent snapshot; they are not claims about current-year conditions or the probability at a specific address.
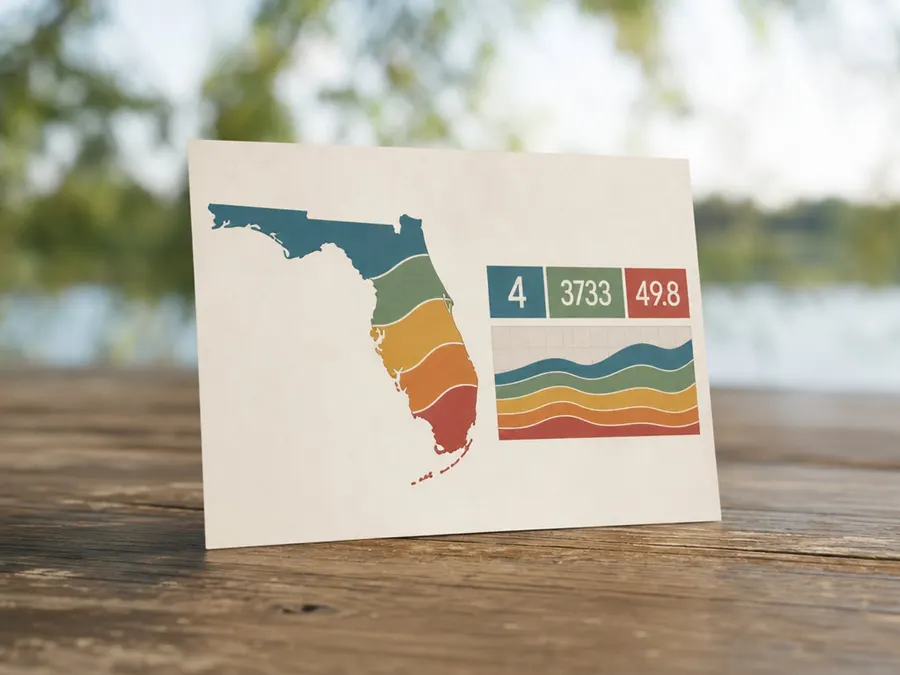
4. Florida — 3,733 recorded tornado-state pairs
Florida ranks fourth with 3,733 distinct tornado-state pairs and a 49.8 annual average across 1950-2024. It is the highest-ranked state in this list outside the central Plains grouping implied by the three leaders. The ranking does not separate tornadoes by strength, season, cause, or county.
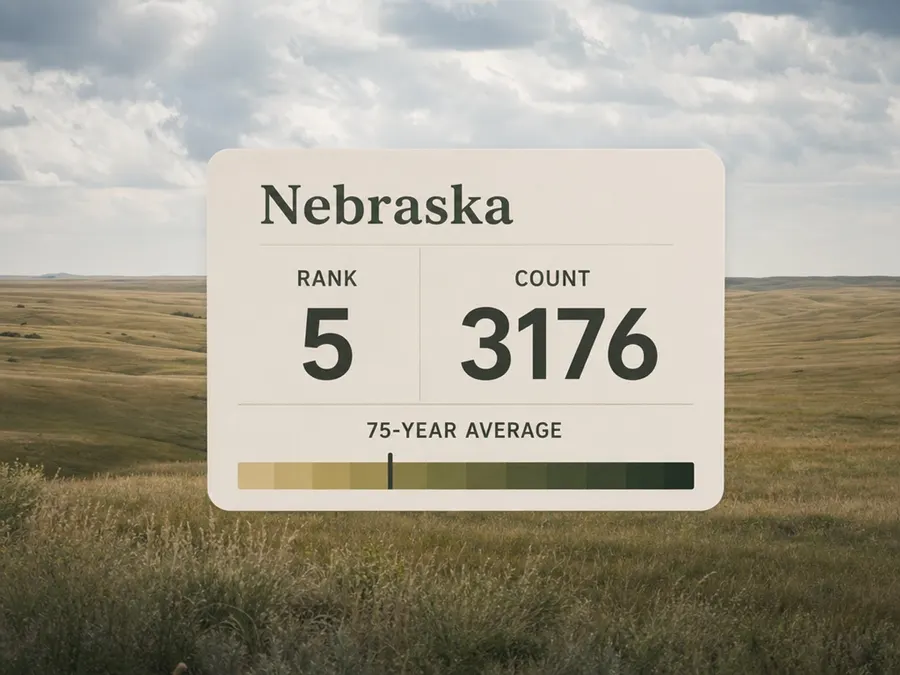
5. Nebraska — 3,176 recorded tornado-state pairs
Nebraska records 3,176 distinct keys in the fixed snapshot, equivalent to 42.3 per year when divided evenly across 75 years. It sits 557 below Florida and 144 above Iowa. That average smooths large year-to-year variation and should never be read as an annual expectation.

6. Iowa — 3,032 recorded tornado-state pairs
Iowa's count of 3,032 produces a simple 40.4-per-year average. Only 22 records separate it from Illinois, the tightest adjacent gap in the top fifteen. Because historical reporting practices changed, that small difference should be treated as a snapshot ordering rather than a durable measure of relative hazard.
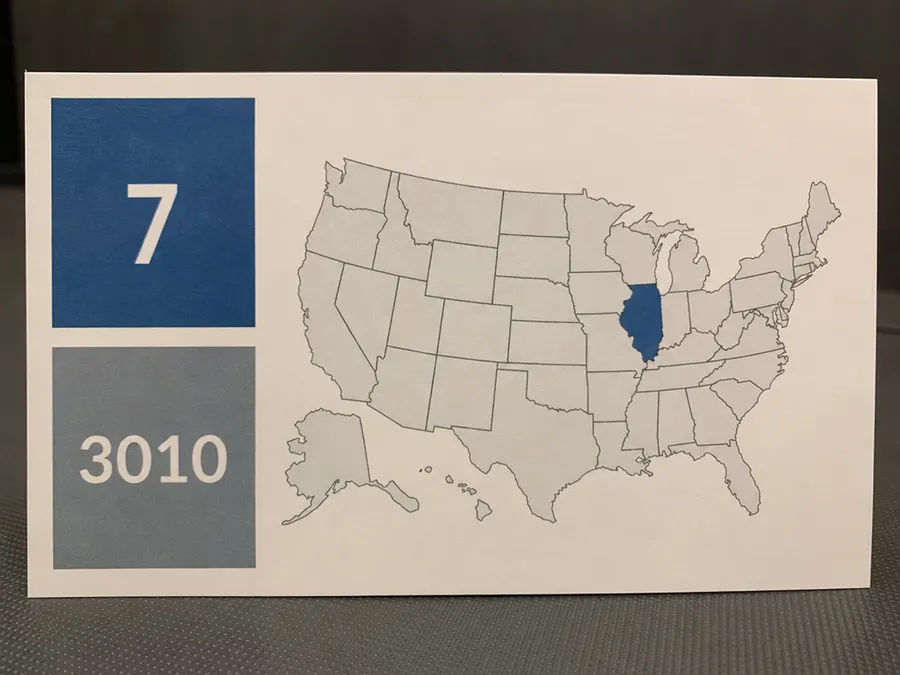
7. Illinois — 3,010 recorded tornado-state pairs
Illinois follows closely at 3,010 records, a simple average of 40.1 per year. It is 22 behind Iowa and 252 ahead of Mississippi. The method counts a cross-state tornado once in Illinois if the official segmented file shows it entering the state, while duplicate Illinois county segments are removed.
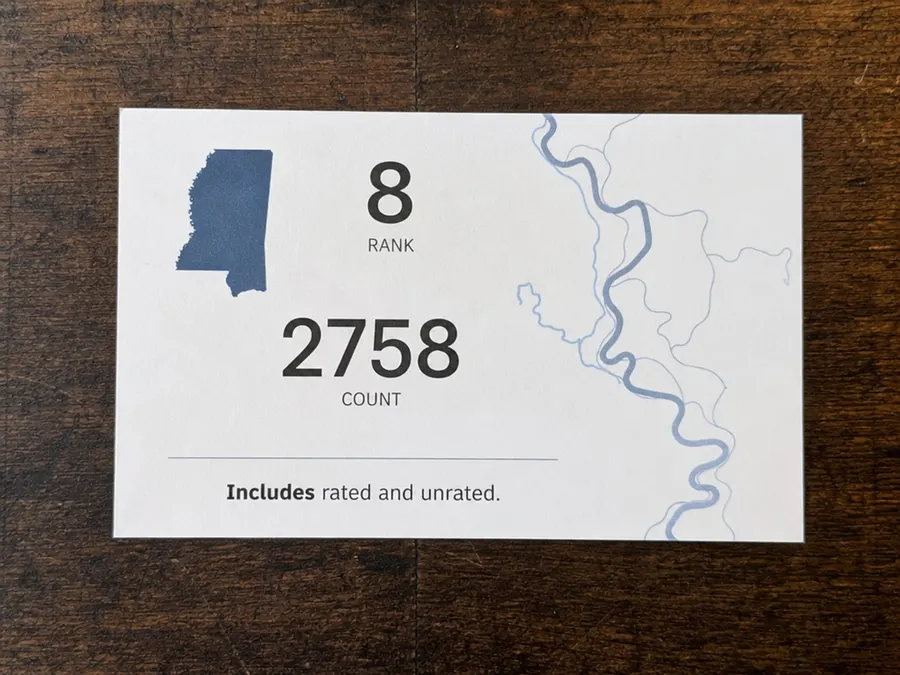
8. Mississippi — 2,758 recorded tornado-state pairs
Mississippi ranks eighth with 2,758 distinct year-tornado-state keys and a simple 36.8 annual average. It leads Alabama by 123 in this snapshot. No severity filter is applied, so the number combines rated and unrated records represented in SPC's all-tornadoes file.

9. Alabama — 2,635 recorded tornado-state pairs
Alabama's 2,635 records average 35.1 per year across the historical window. Just 33 records separate Alabama from Missouri, so a changed data vintage or method could affect their ordering. This page therefore binds both the source bytes and the aggregate table instead of presenting the rank as timeless.
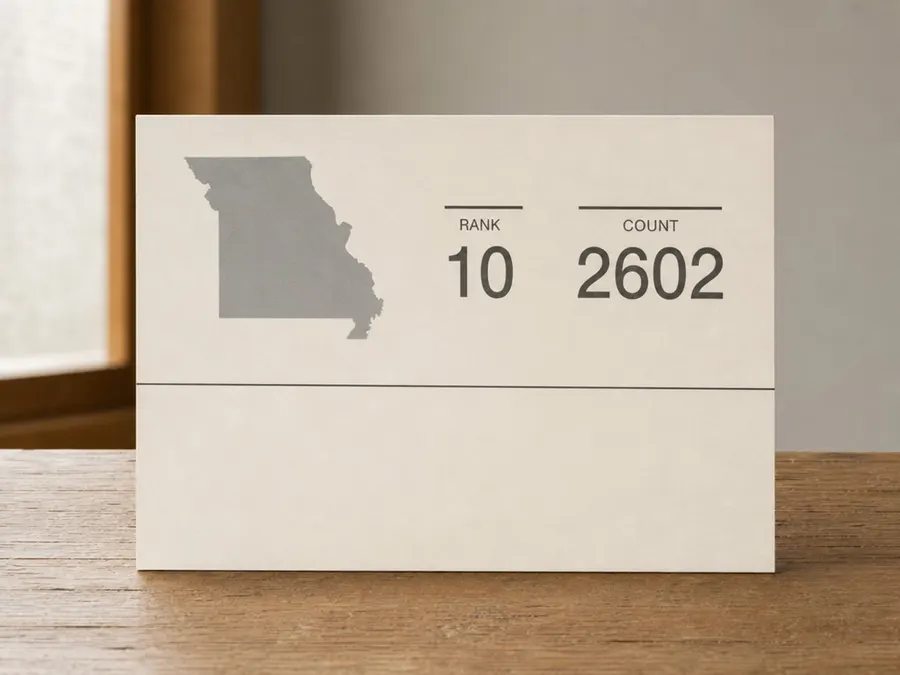
10. Missouri — 2,602 recorded tornado-state pairs
Missouri closes the top ten at 2,602 distinct keys, a simple 34.7-per-year average. It sits 33 behind Alabama and 154 ahead of Colorado. The count includes every official magnitude value in the file and measures occurrence records, not deaths, injuries, damage, or financial loss.

11. Colorado — 2,448 recorded tornado-state pairs
Colorado has 2,448 records, averaging 32.6 per year over the fixed period. Its total is only 26 above Louisiana, another close adjacent pair. Statewide raw totals can hide large internal geographic differences, so the card deliberately avoids shading every part of a state as equally exposed.

12. Louisiana — 2,422 recorded tornado-state pairs
Louisiana's 2,422 distinct keys equal a simple annual average of 32.3. The state trails Colorado by 26 and leads Minnesota by 254. This count does not distinguish tornadoes associated with tropical systems from other entries; adding that classification would require a separate, explicitly sourced analysis.
13. Minnesota — 2,168 recorded tornado-state pairs
Minnesota records 2,168 distinct tornado-state pairs, or 28.9 per year under the simple 75-year calculation. It is 254 behind Louisiana and 86 ahead of Arkansas. The long window combines many observation eras, so readers should not compare early and late decades without a separate methodology review.
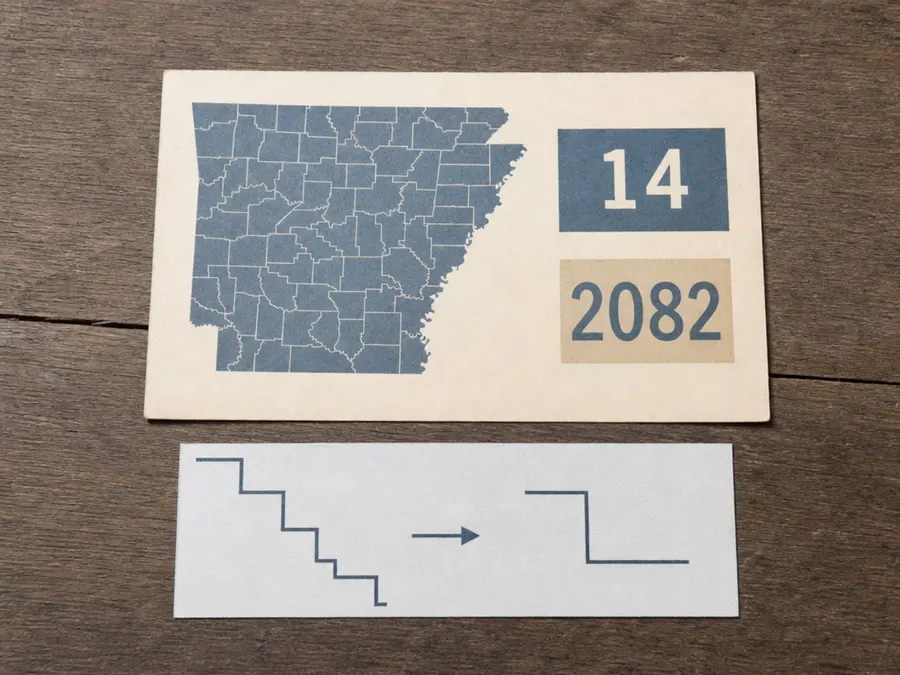
14. Arkansas — 2,082 recorded tornado-state pairs
Arkansas has 2,082 records in the fixed aggregate, a simple average of 27.8 per year. It trails Minnesota by 86 and leads Georgia by 116. The value is a count of distinct state encounters, so repeated county segments from the same tornado do not inflate the Arkansas total.

15. Georgia — 1,966 recorded tornado-state pairs
Georgia completes this top fifteen with 1,966 distinct keys, or 26.2 per year across 1950-2024. It is 116 below Arkansas. Historical ranking never replaces current alerts: during a Tornado Warning, National Weather Service guidance is to move promptly to a basement, safe room, or interior lowest-floor room away from windows.

1. Texas — 9,481 recorded tornado-state pairs
Texas ranks first in this 1950-2024 raw-total method, averaging 126.4 recorded tornadoes per year across the 75-year window. Its count is 4,908 above second-place Kansas and a little more than twice the Kansas total. The number describes historical records, not equal risk across every part of Texas.
Featured galleries