15 States With the Highest Reported Violent-Crime Rates in 2024
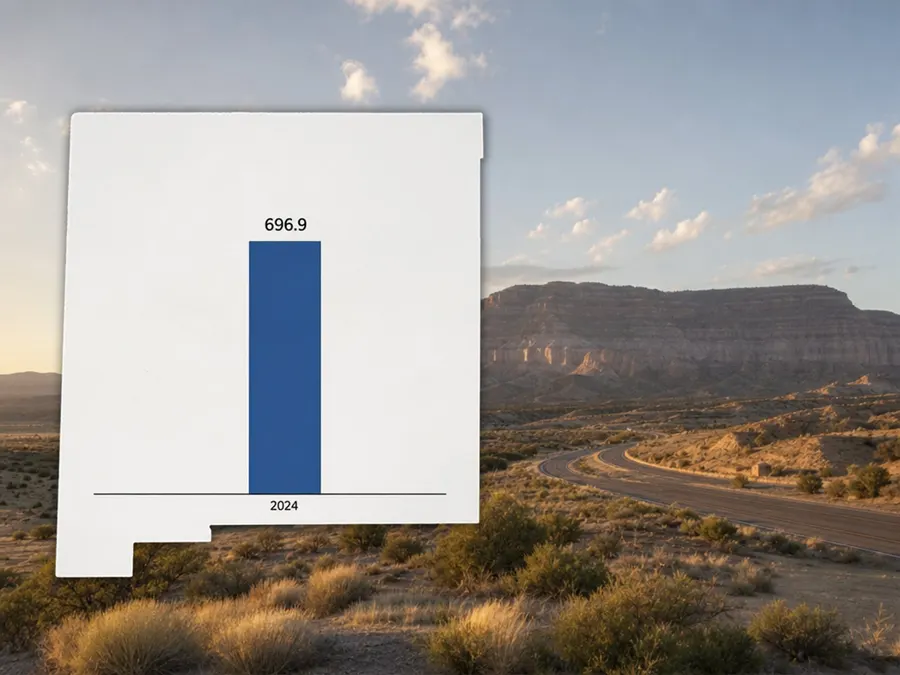
New Mexico — 696.9 per 100,000
New Mexico ranks second at 696.9 reported violent crimes per 100,000 residents. That estimate supports a state-to-state rate comparison, not claims about a particular town, visitor route or demographic group. Counts, offense composition and agency-level trends are necessary before interpreting any local pattern.
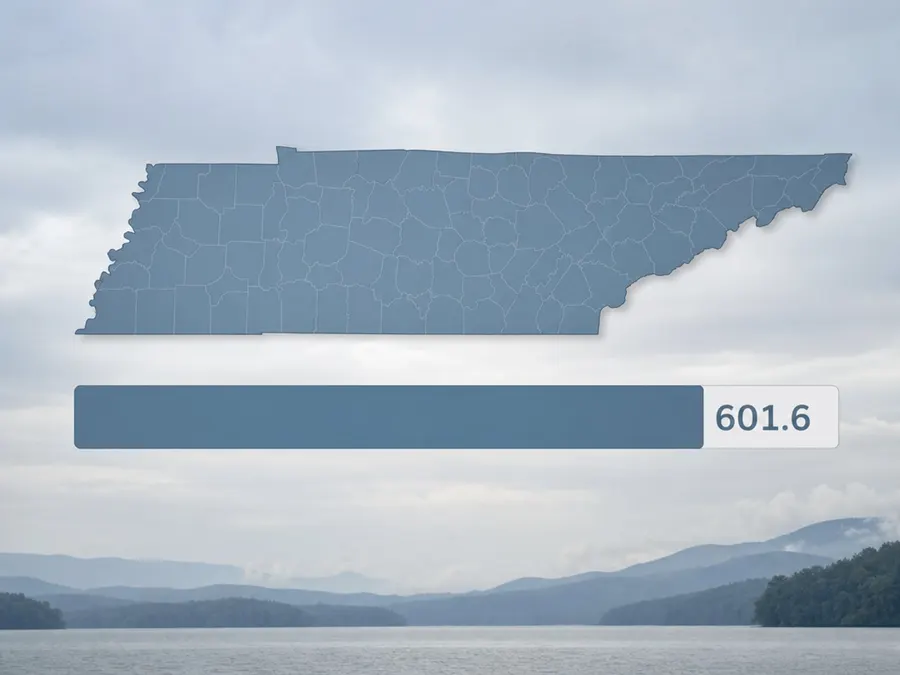
Tennessee — 601.6 per 100,000
Tennessee's 2024 estimate was 601.6 per 100,000. The denominator makes states of different sizes comparable, but the single total still blends places with very different patterns. For policy or travel decisions, examine the relevant local jurisdiction, offense mix, reporting coverage and recent direction of change.
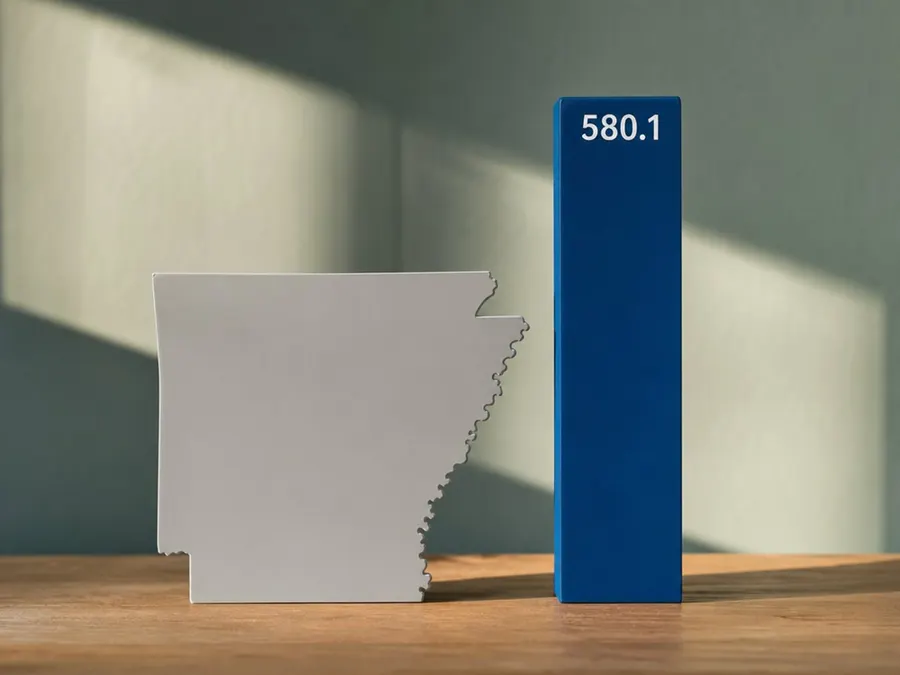
Arkansas — 580.1 per 100,000
Arkansas recorded an estimated 580.1 violent crimes per 100,000 residents in the FBI's 2024 table. Rank gaps should not be overread: small year-to-year movements can change positions. Use a multi-year trend and uncertainty-aware local context instead of labeling the whole state safe or unsafe.
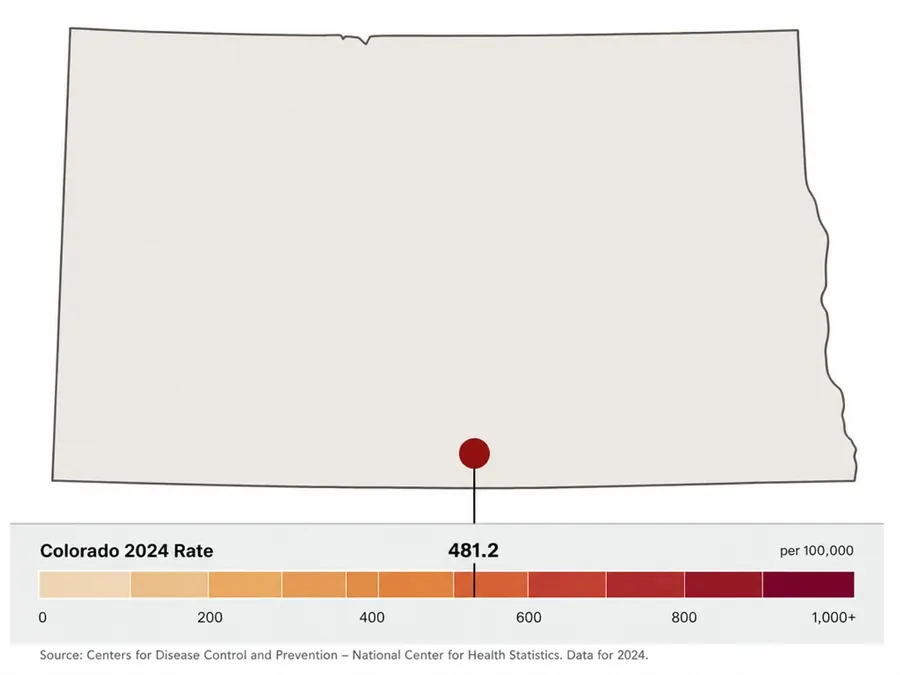
Colorado — 481.2 per 100,000
Colorado's reported violent-crime estimate was 481.2 per 100,000 for 2024. The rate is not the probability that a randomly chosen resident will be victimized; incidents and people can be counted under specific rules, and exposure varies. Local Crime Data Explorer results provide more decision-relevant detail.

California — 476.8 per 100,000
California's 2024 estimate was 476.8 violent crimes per 100,000 residents. Its large population and regional diversity make the statewide mean especially blunt. A claim about a city or neighborhood cannot be inferred from this slide; use that jurisdiction's reported data and compare like offense definitions and years.
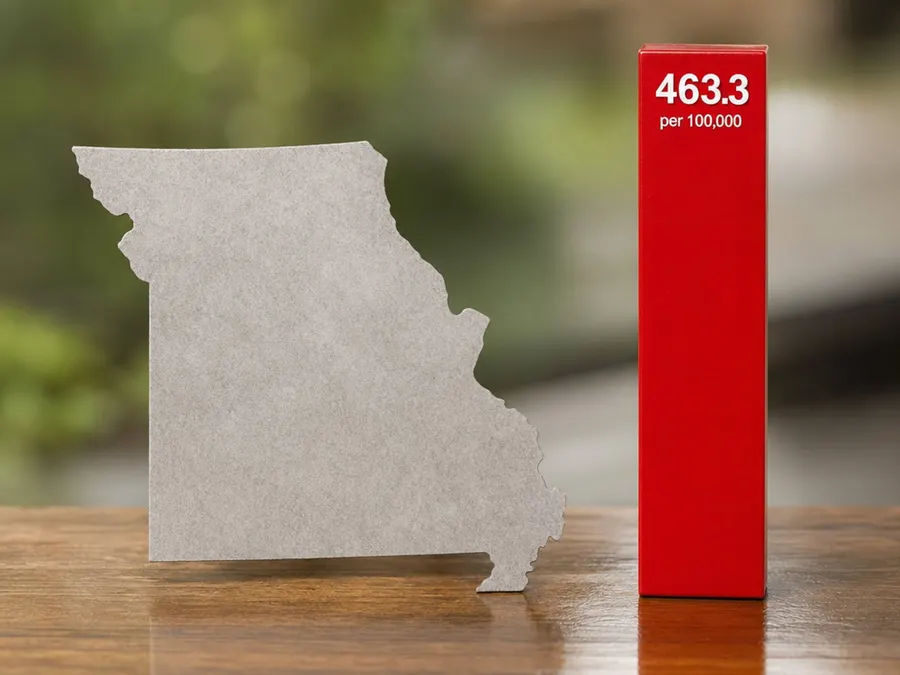
Missouri — 463.3 per 100,000
Missouri appears at 463.3 per 100,000 in the 2024 FBI estimate. State rank does not identify which prevention strategy would work, because offense categories and local circumstances differ. Diagnosis requires incident-level or agency-level evidence, community knowledge and time trends—not a national list's position number.
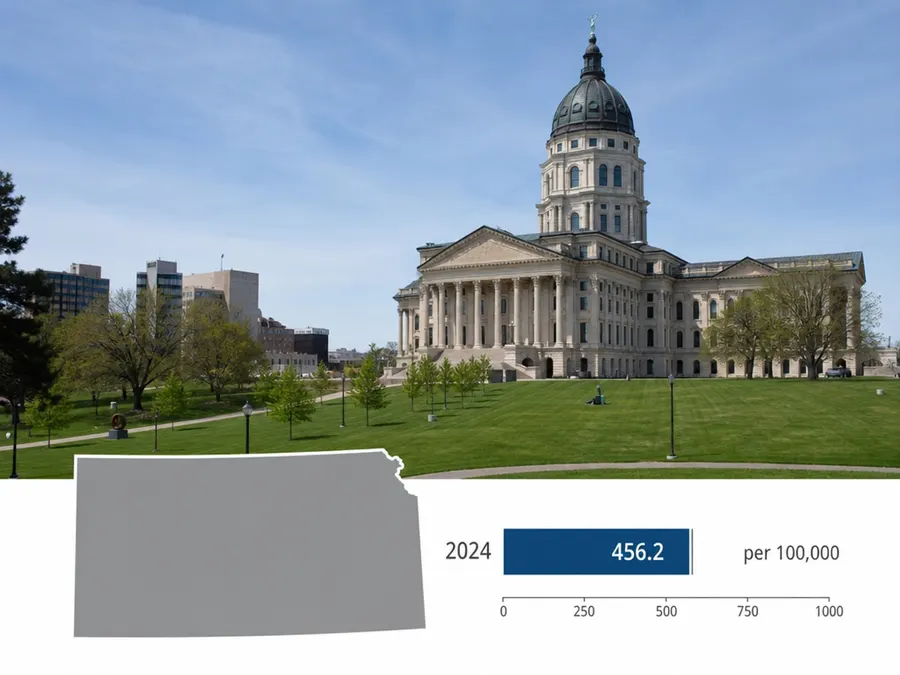
Kansas — 456.2 per 100,000
Kansas had an estimated 456.2 reported violent crimes per 100,000 people in 2024. The figure should be read alongside participation and reporting notes. It is appropriate for a defined annual comparison, but not for assigning motives, judging communities or substituting for current local public-safety information.
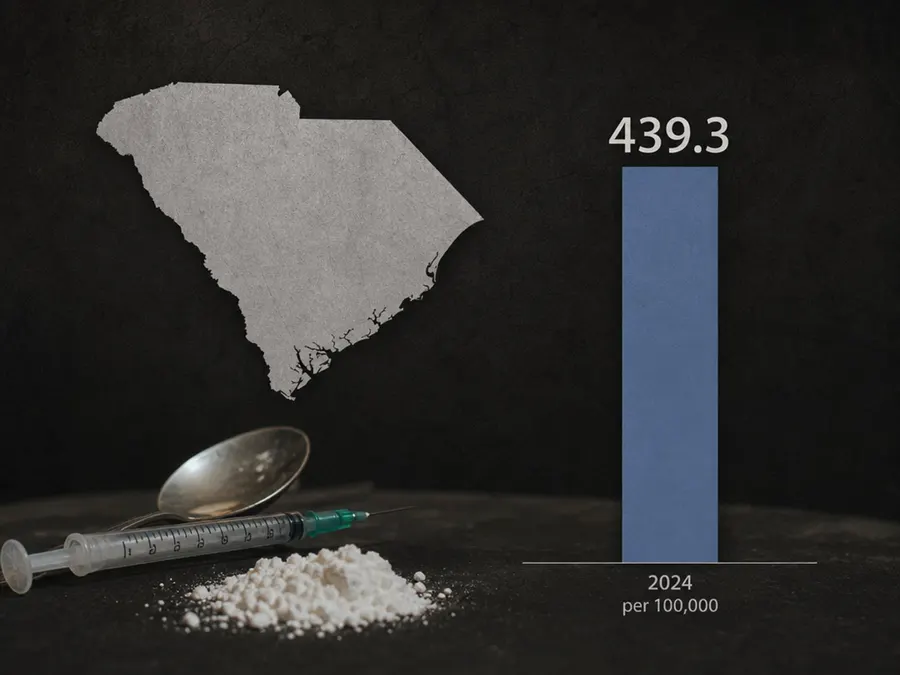
South Carolina — 439.3 per 100,000
South Carolina's 2024 estimate was 439.3 per 100,000. A rate standardizes for population, yet it does not standardize every difference in agency practice or community composition. For meaningful interpretation, inspect the four violent-offense components and the specific agencies contributing to the place of interest.
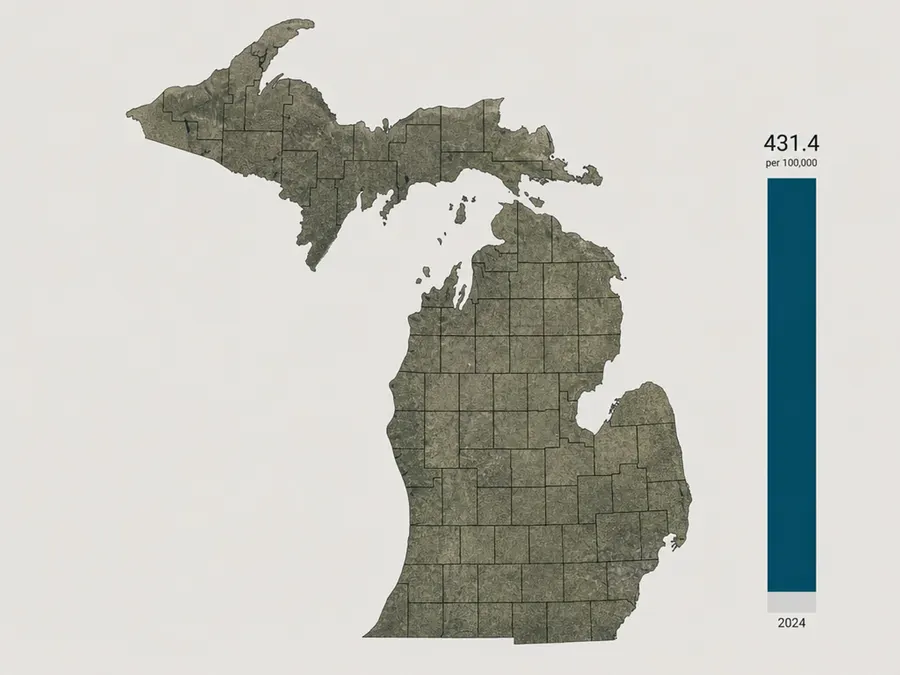
Michigan — 431.4 per 100,000
Michigan's FBI estimate was 431.4 reported violent crimes per 100,000 residents in 2024. The statewide rate combines numerous agencies and very different community settings. It cannot justify claims about a named neighborhood, and a one-year placement should not be presented as an irreversible trajectory.

Arizona — 428.6 per 100,000
Arizona recorded an estimated 428.6 violent crimes per 100,000 residents in 2024. Seasonal populations, tribal and nontribal jurisdictions, city variation and reporting coverage all complicate casual interpretation. Use the rate as a state benchmark only; seek jurisdiction-appropriate sources for a local safety or policy question.
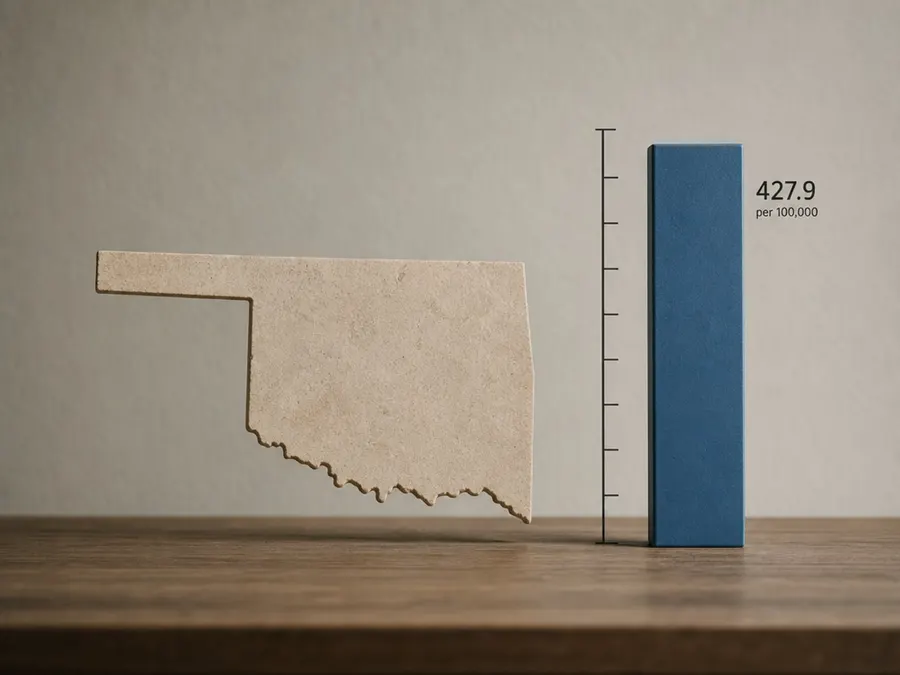
Oklahoma — 427.9 per 100,000
Oklahoma's 2024 violent-crime rate estimate was 427.9 per 100,000, only 0.7 below Arizona in this table. That narrow gap illustrates why ordinal rank can imply more separation than the data contain. The actual value, offense mix and longer trend are more informative than twelfth versus eleventh.
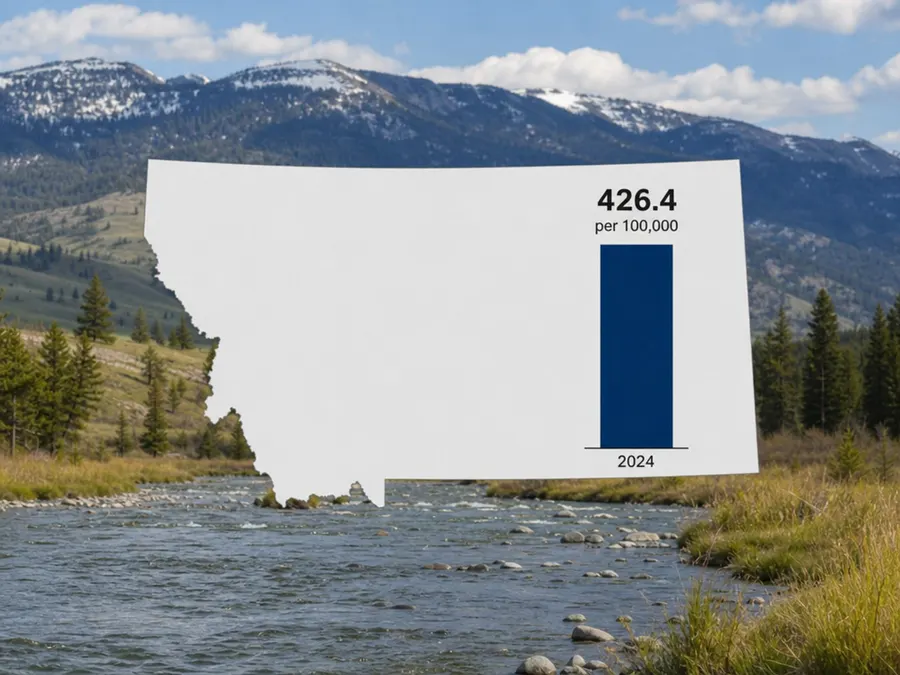
Montana — 426.4 per 100,000
Montana's estimate was 426.4 reported violent crimes per 100,000 residents in 2024. Low population and large geography do not invalidate a rate, but they can make annual changes and local concentration especially important. Consult counts, agency coverage and several years before making a trend claim.
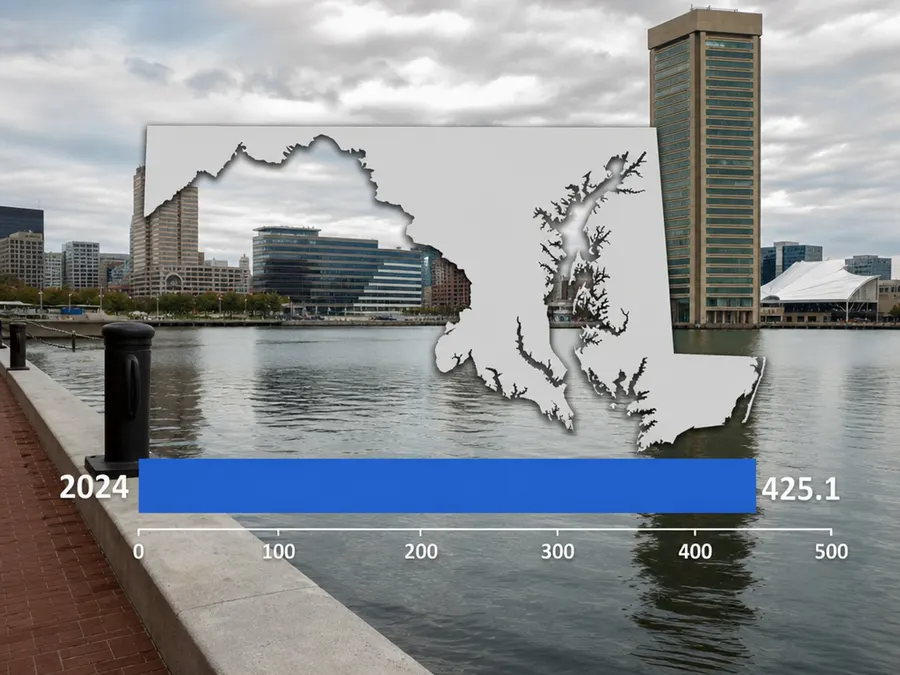
Maryland — 425.1 per 100,000
Maryland's 2024 estimate was 425.1 violent crimes per 100,000. The state includes dense metropolitan jurisdictions, suburbs and rural counties whose patterns should not be collapsed when making a local decision. Because ranks 11 through 14 are close, precision requires values and methods, not a dramatic color tier.
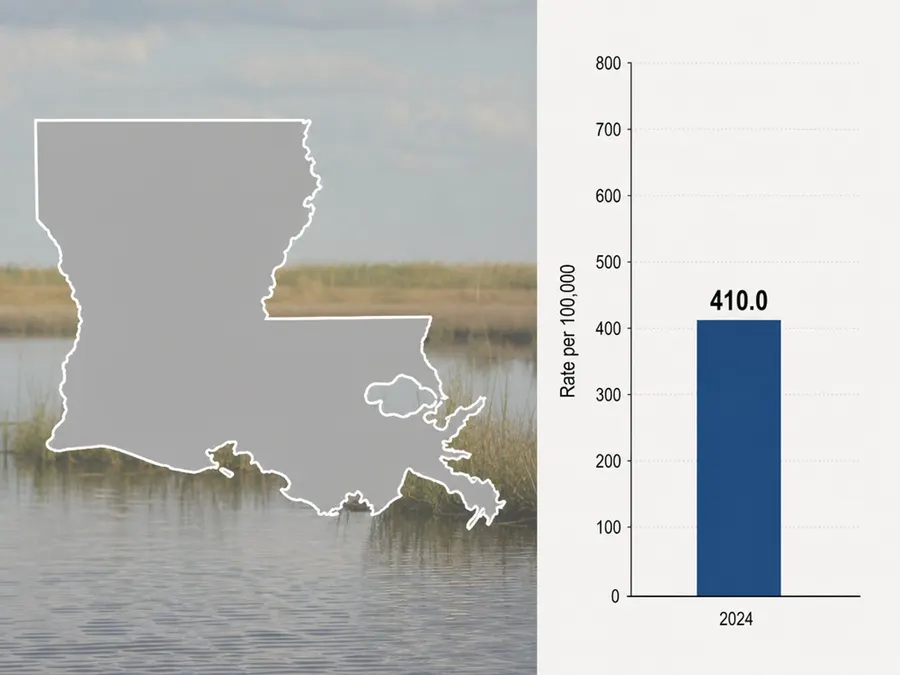
Louisiana — 410.0 per 100,000
Louisiana closes this top-fifteen state list at an estimated 410.0 per 100,000 in 2024. Being fifteenth here is not a safety threshold; the next states simply fall below it in this particular year and measure. Responsible use preserves the year, definition, unit and reporting caveats together.
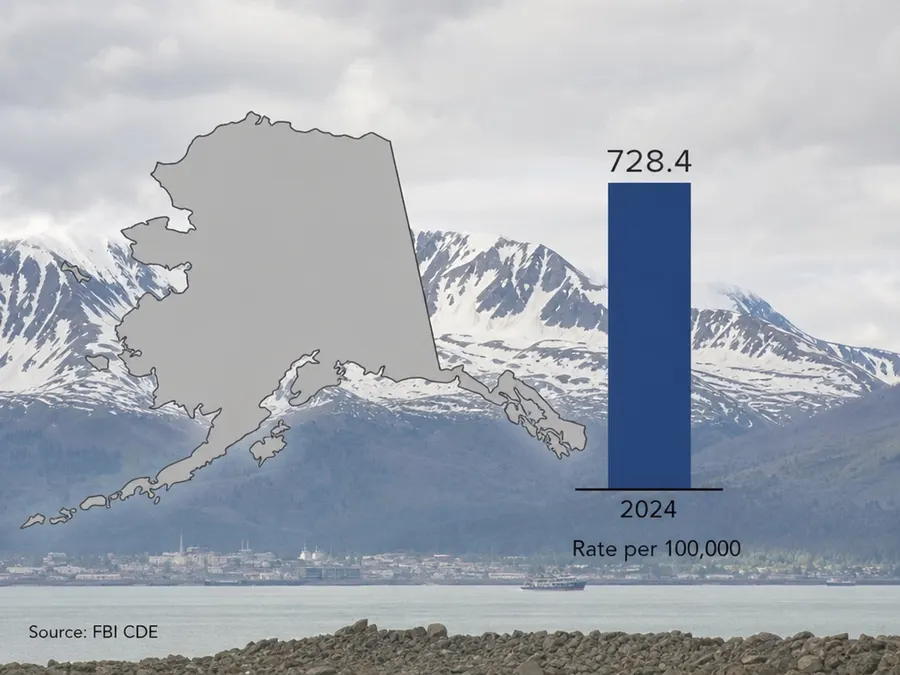
Alaska — 728.4 per 100,000
Alaska had the highest 2024 state violent-crime rate in this comparison. A statewide figure spread across remote communities and urban centers cannot explain where risk concentrates or why. Compare local agency data and multiple years before drawing conclusions; never treat the rate as a trait of residents.
Featured galleries