The 15 Most Populous U.S. States in the 2025 Census Estimates
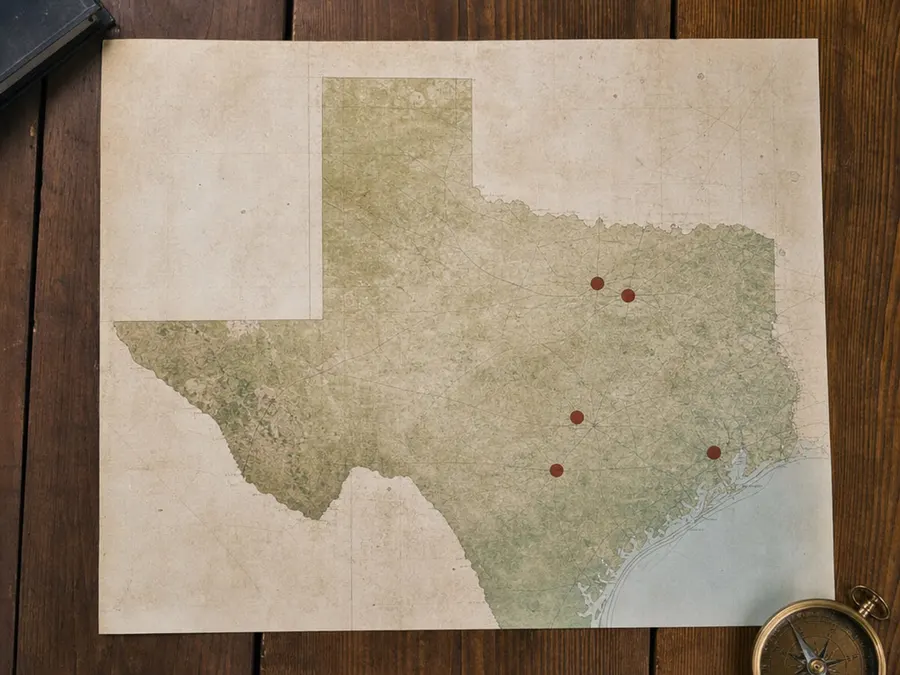
Texas — 31,709,821
Texas is second and added residents between the Vintage 2025 estimates for 2024 and 2025. Its population is distributed across several very large metropolitan areas plus extensive rural territory. Growth in a state total does not mean every county, school district, or housing market grew equally.
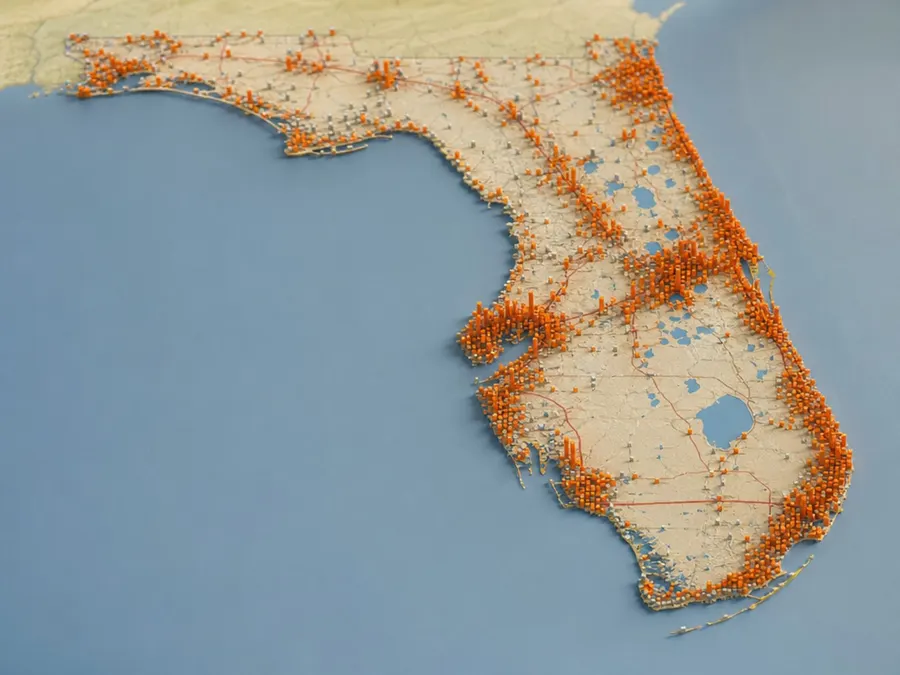
Florida — 23,462,518
Florida ranks third. Migration, aging, births, deaths, and international movement all contribute to population change, and the Census Bureau reported a sharp slowdown in net domestic migration compared with earlier years. Coastal exposure and seasonal visitors are important planning issues but are not included as resident population.

New York — 20,002,427
New York narrowly remained above 20 million in the 2025 estimate. New York City dominates perceptions, yet the state's resident count also includes Long Island, Hudson Valley, upstate metros, and large rural areas. Municipal, metropolitan, and statewide population figures answer different geographic questions.
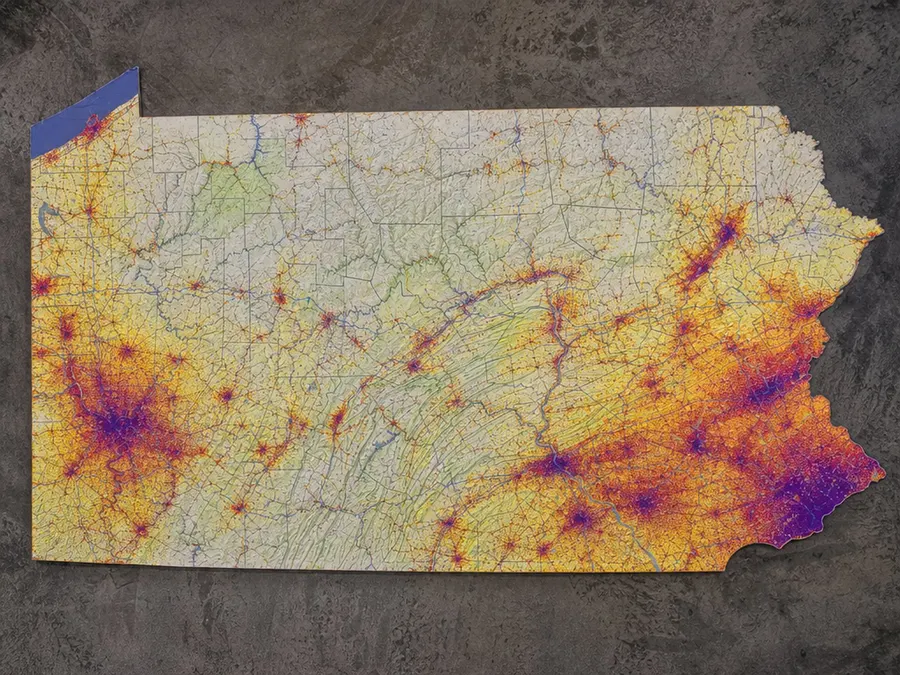
Pennsylvania — 13,059,432
Pennsylvania ranks fifth, shaped by the Philadelphia and Pittsburgh regions as well as smaller cities and rural counties. Its modest statewide change should not be read as stasis everywhere. County-level estimates are needed to see which communities grew, declined, or shifted through births, deaths, and migration.

Illinois — 12,719,141
Illinois is sixth. The Chicago region contains most residents, while central and southern Illinois have different demographic patterns. A statewide total can conceal urban-suburban movement and county declines. For service planning, the age structure and location of residents often matter more than the rank itself.
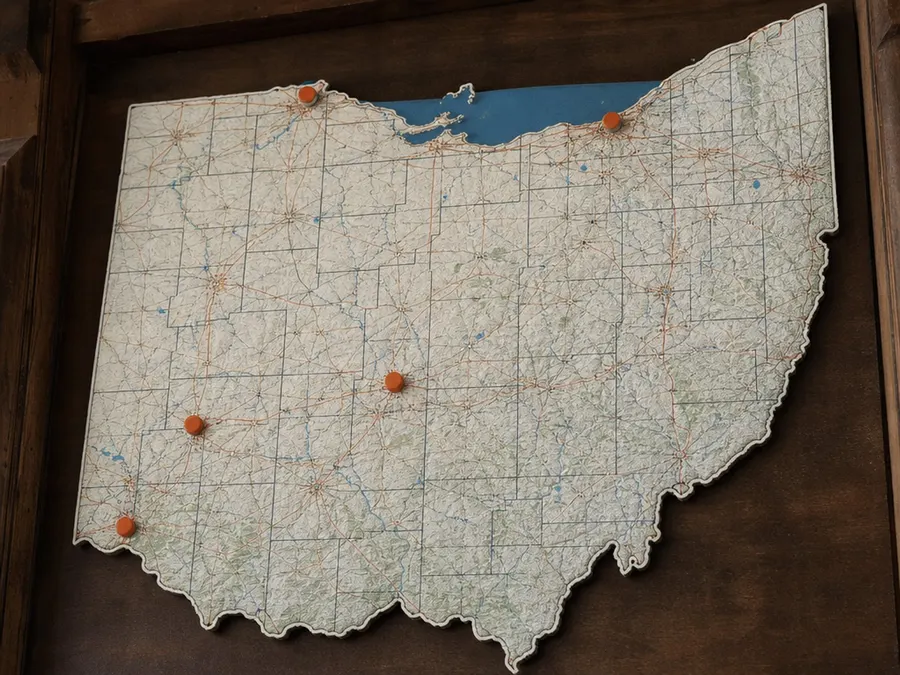
Ohio — 11,900,510
Ohio ranks seventh and approaches 12 million residents. Its population is spread among several metropolitan regions rather than dominated by one city to the same degree as Illinois or New York. That polycentric pattern makes state totals useful for scale but insufficient for comparing local growth.
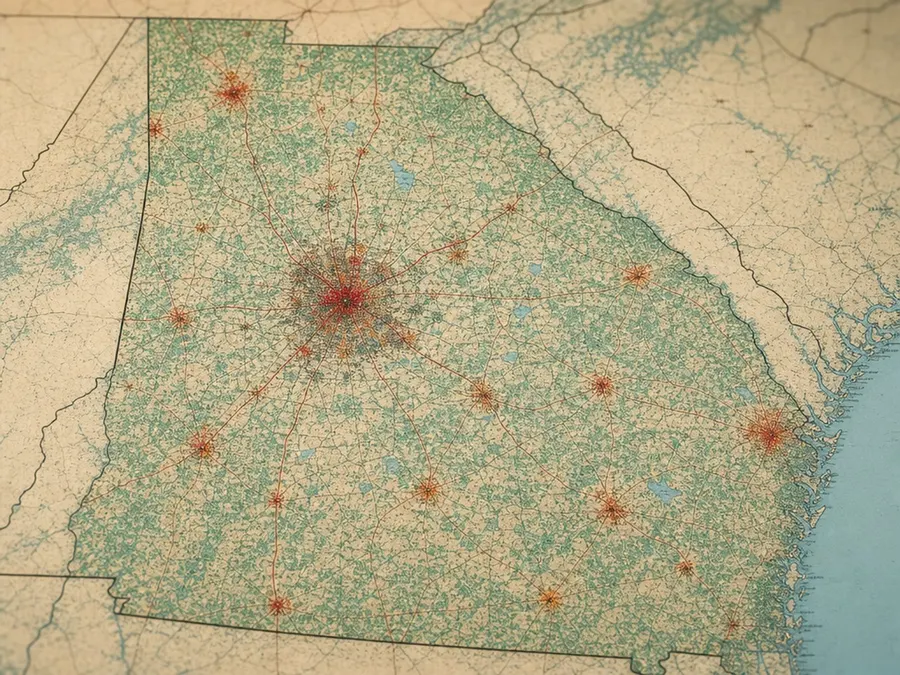
Georgia — 11,302,748
Georgia is eighth, with the Atlanta region a major driver of statewide scale and change. Other metros, coastal counties, and rural communities follow different trajectories. Population growth can increase demand for housing, water, schools, and transportation, but the estimate alone does not measure whether capacity kept pace.

North Carolina — 11,197,968
North Carolina ranks ninth, close behind Georgia. The Research Triangle, Charlotte, Triad, mountains, and coast represent distinct settlement and risk patterns. State rank is not a recommendation to move; local employment, insurance, infrastructure, and hazard exposure require county- or metro-level evidence.

Michigan — 10,127,884
Michigan completes the Census Bureau's published top ten and is the last state above ten million in this vintage. Detroit's metro is central, but Grand Rapids, Lansing, smaller cities, and two peninsulas complicate the picture. Water-rich geography also makes total area a poor proxy for settlement.

New Jersey — 9,548,215
New Jersey ranks eleventh despite being one of the smallest states by land area. That contrast illustrates why population and density must be kept separate. Its connection to New York and Philadelphia metros crosses state lines, so a state-only map cannot describe the full commuter economy.

Virginia — 8,880,107
Virginia is twelfth. Northern Virginia, Richmond, Hampton Roads, mountain regions, and rural counties differ sharply in density and growth. Federal employment and military presence matter to some local economies, but this gallery ranks resident counts only and makes no causal claim from the total.

Washington — 8,001,020
Washington crossed eight million in the 2025 estimate and ranks thirteenth. Population is heavily concentrated around Puget Sound, with different patterns east of the Cascades and in southwest Washington. Geographic barriers, ferries, and mountain passes make resident count a weak stand-in for practical connectivity.
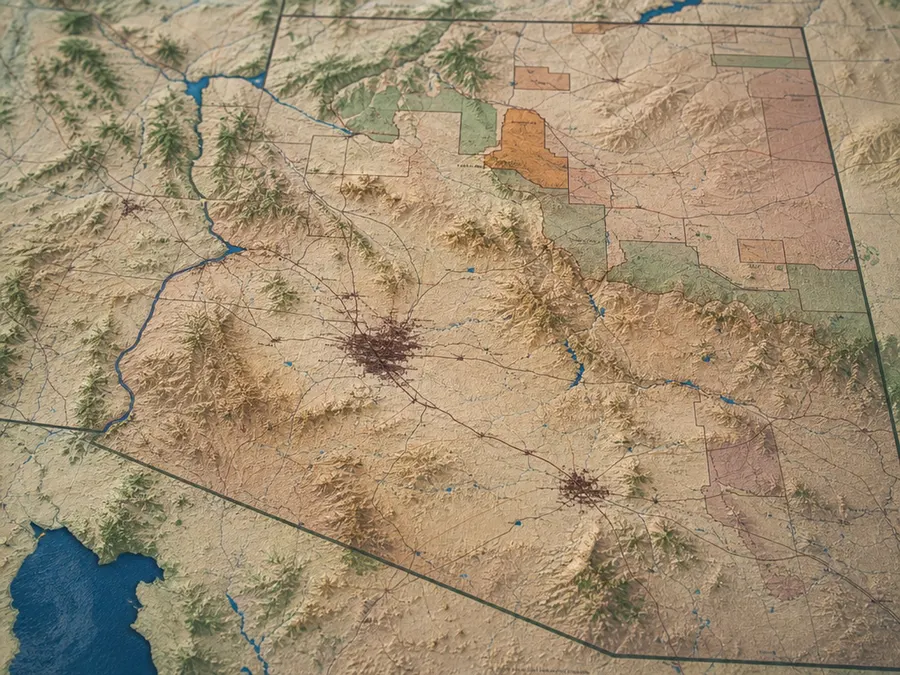
Arizona — 7,623,818
Arizona ranks fourteenth. The Phoenix metro dominates the resident total, while Tucson, tribal lands, border communities, and northern high country have distinct demographics. Growth discussions should include extreme heat and water planning, but this rank itself measures neither resources nor resilience.

Tennessee — 7,315,076
Tennessee completes the top 15. Nashville, Memphis, Knoxville, Chattanooga, and rural regions create several different population stories within the same long state. The ranking is a dated statistical snapshot; users studying services, representation, or markets should move next to local and demographic tables.

California — 39,355,309
California remains first, although its 2025 estimate was slightly below 2024 within the same vintage. The total spans huge differences between coastal metros, inland valleys, mountain counties, and the far north. A statewide head count should never be treated as one housing or labor market.
Featured galleries