15 Checks Before Calling a U.S. City ‘Safe’

Check FBI Participation and Coverage
The FBI Crime Data Explorer shows reported offenses from participating law-enforcement agencies. Missing or partial agency data can distort a city comparison, especially across the transition to newer reporting systems. Read coverage notes before dividing counts by population or presenting a rank with false certainty.

Separate Violent and Property Offenses
A combined crime total can be dominated by high-volume property offenses and obscure rarer violent harms. Present categories separately and define which offenses are included. Reporting behavior, insurance practices, and enforcement priorities can affect recorded property crime, so even category-specific comparisons need local context.

Use Rates and Counts Together
Counts show service burden; rates adjust for population size. A small city can post a volatile rate after a modest change in incidents, while a large city can have many incidents but a lower per-capita rate. Show both, state the population source, and consider multi-year patterns for small numbers.

Match City Boundaries Correctly
A central city, county, metropolitan area, and police jurisdiction can cover different populations. Dividing an agency count by the wrong denominator creates a meaningless rate. Confirm the reporting geography and watch for university, transit, park, or overlapping agencies before comparing places.
Look Beyond One Calendar Year
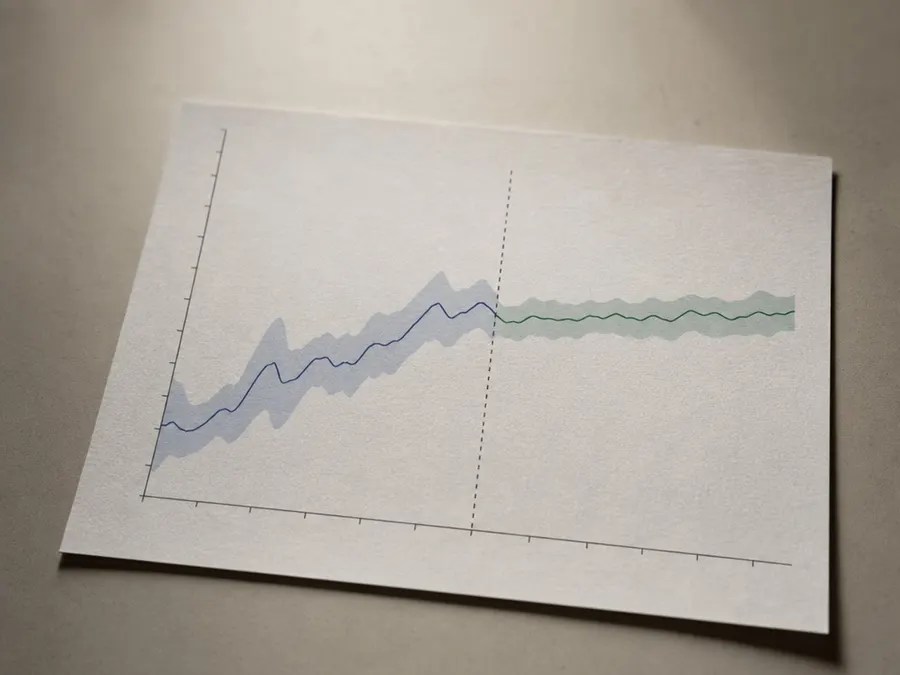
One year can reflect random variation, a reporting change, a large unusual event, or delayed submissions. Plot several comparable years and mark breaks in methodology. A downward trend deserves cautious description, not a permanent safe label; conditions and reporting can change.

Read Local Open Data and Definitions
City dashboards may provide neighborhood, call-for-service, collision, or incident details unavailable nationally. They can also use different update schedules and definitions. Read the data dictionary, distinguish calls from confirmed offenses, and never map an exact household or victim location from sensitive records.

Include Traffic Deaths and Serious Injuries
For many residents, street design and driving exposure shape daily risk more than reported crime. Use federal and local transportation sources to examine deaths, serious injuries, pedestrian and cyclist harm, and road design. Do not combine traffic and crime into an arbitrary score without transparent weights.
Assess Climate and Disaster Exposure
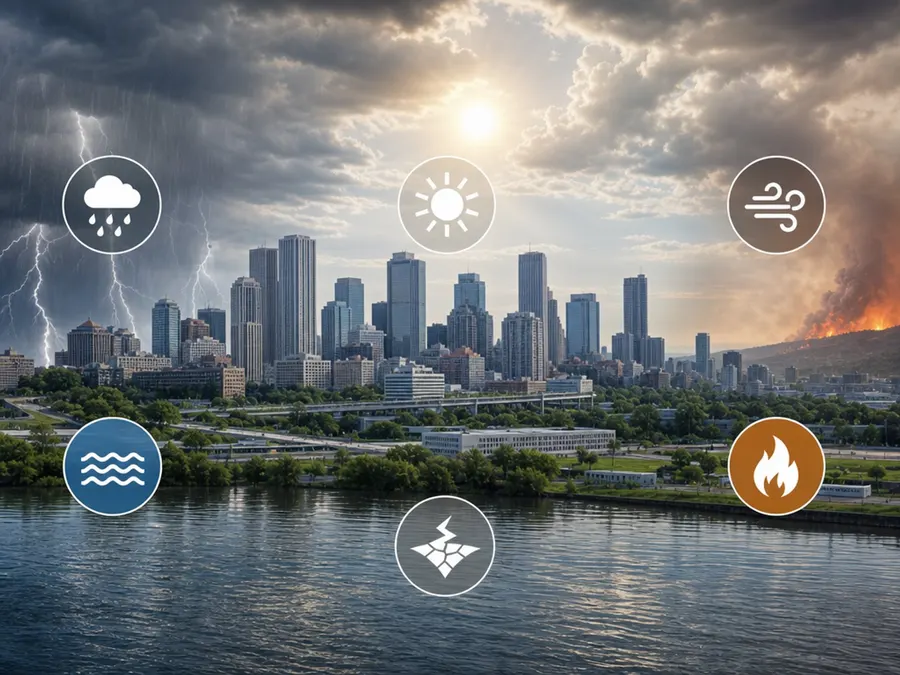
Flood, wildfire, heat, hurricane, winter weather, and earthquake risks differ by place and even block. FEMA's National Risk Index is a screening tool, not a property-level guarantee. Pair it with local hazard plans, evacuation routes, insurance information, and building-specific due diligence.

Check Emergency and Health-System Access
Distance to trauma care, ambulance availability, public-health capacity, and language access affect outcomes but are hard to reduce to one number. Use official state and local sources, recognize rural and urban tradeoffs, and avoid assuming that a hospital count alone measures timely or affordable care.

Examine Workplace Safety
A city's economy can expose workers to different transportation, construction, industrial, heat, or violence risks. OSHA data and state programs offer one view, but workforce mix matters. Compare industries and employment levels rather than treating raw inspection or fatality counts as a city-quality score.

Measure Housing Conditions and Displacement Risk
Safe housing involves code enforcement, fire protection, lead hazards, indoor temperature, accessibility, and freedom from displacement or abuse. Aggregate city averages can conceal poor conditions. Consult housing agencies and tenant protections, and never use neighborhood labels to stigmatize residents or justify discrimination.

Ask Who Experiences Safety Differently
Disability, race, gender, age, immigration status, occupation, housing, and prior contact with institutions can shape exposure and willingness to report. Community surveys add context, but sampling and question wording matter. Do not present one average perception as the voice of every resident.

Avoid Reverse-Causality Stories
More calls or reports can reflect more harm, easier reporting, greater trust, targeted enforcement, or some combination. A correlation between a policy and a recorded rate does not prove cause. Use rigorous evaluations and local timelines before crediting or blaming a single leader, law, or demographic change.

Publish a Profile, Not a Trophy
A responsible comparison states data years, definitions, coverage, boundaries, uncertainty, and dimensions that were left out. It shows tradeoffs instead of crowning one city. The useful product is a safety profile readers can update for their own decision—not a permanent badge that cities market and residents are forced to defend.

Define the Safety Question First
A family choosing a walking route, an older adult comparing emergency response, and a business planning flood resilience need different evidence. Write down the decision, population, geography, and period before selecting a metric. A vague safest-city label hides these choices and invites whatever number produces the desired headline.
Featured galleries