12 Checks for Evaluating an Iceberg-Approaches-Town Story
Understanding Iceberg Size Thresholds
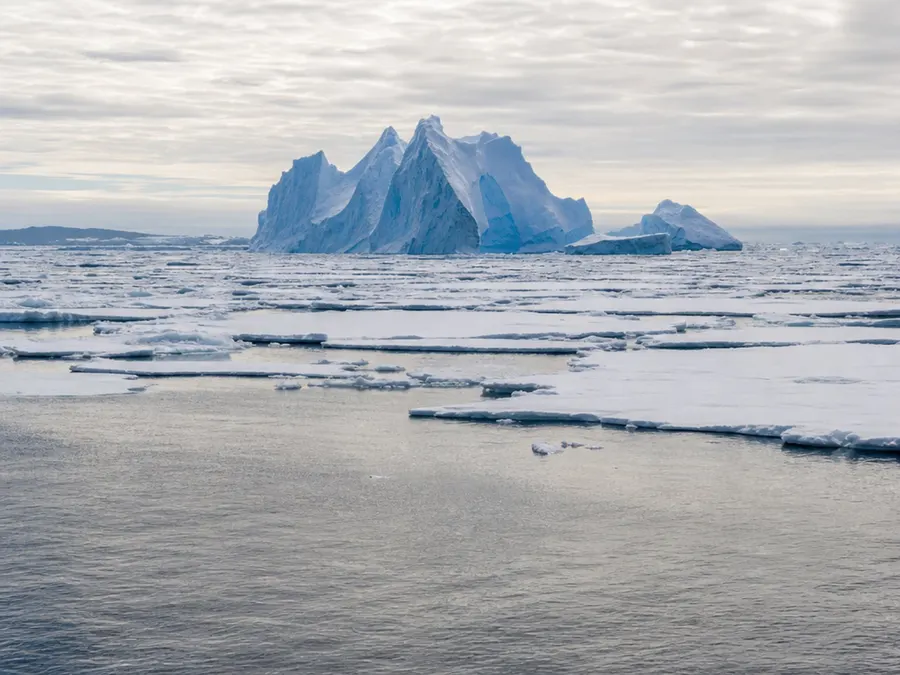
Not all icebergs are large enough to be tracked by official monitoring agencies. Historically, the USNIC tracked icebergs in the Southern Hemisphere using a minimum size criterion of 10 nautical miles on the longest axis. Due to improved satellite imagery resolution and availability, they are expanding these criteria to include icebergs of 20 square nautical miles or greater. Smaller icebergs may not appear in official tracking databases.
Analyzing Satellite Imagery Technologies
To verify ground-level reports of icebergs, professional ice analysts rely on advanced remote sensing technologies. They utilize a combination of Synthetic Aperture Radar (SAR), visible, and infrared remotely sensed imagery. These imaging tools are used to locate and track icebergs during routine monitoring of sea ice conditions. This combination of remote sensing data helps ensure accurate tracking across monitored regions.
Decoding Antarctic Iceberg Quadrants A and B
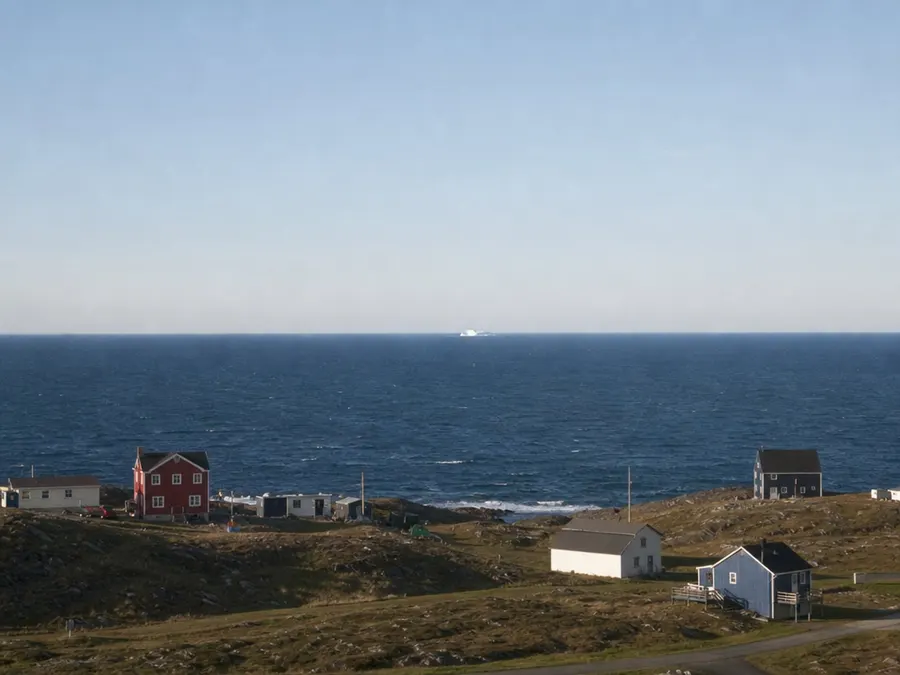
Official iceberg names provide clues about where the iceberg originated. The naming convention for Antarctic icebergs is derived from the specific quadrant in which they were first sighted. Quadrant A covers the Bellingshausen and Weddell Sea from 0 to 90 degrees West. Quadrant B covers the Amundsen and Eastern Ross Sea from 90 degrees West to 180 degrees.
Decoding Antarctic Iceberg Quadrants C and D
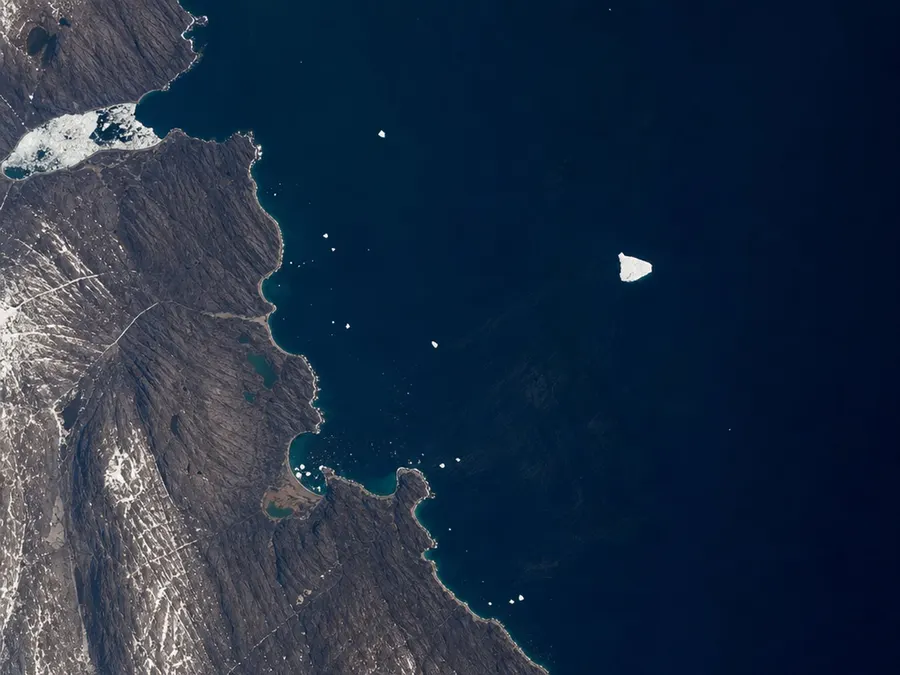
The remaining sectors of the Antarctic continent are divided into two other quadrants. Quadrant C covers the Western Ross and Wilkesland Sea from 180 degrees to 90 degrees East. Quadrant D spans from 90 degrees East to 0 degrees, covering the Amery and Eastern Weddell Sea. This system ensures that every tracked Antarctic iceberg has a designated point of origin.
Understanding Iceberg Numbering and Calving
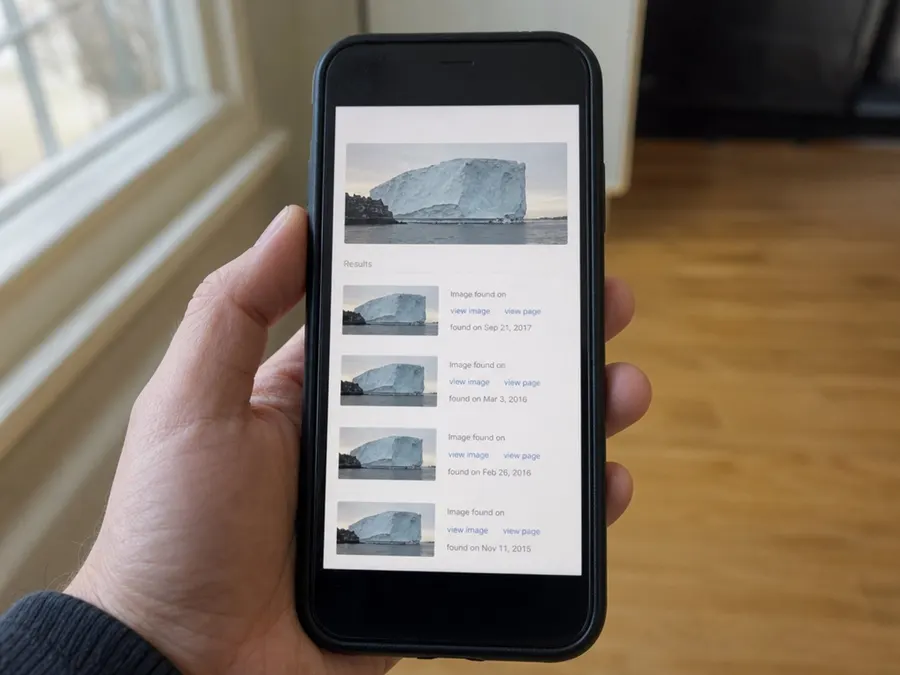
When an iceberg is first sighted, it is assigned the letter of its quadrant along with a sequential number. For example, C-19 is sequentially the 19th iceberg tracked by the USNIC in Quadrant C. If an iceberg splits, the resulting pieces that calve off are given letter suffixes. These suffixes are added in sequential order to document the calving event.

Tracking New Iceberg Announcements
When a major new iceberg is detected, official tracking agencies issue public notifications. Newly named icebergs warrant a press release from the USNIC, which can be found in their online News section. After their initial discovery, all named icebergs are tracked and documented weekly. This ongoing information is made available on the Antarctic Icebergs page.
Distinguishing Marginal Ice Zones
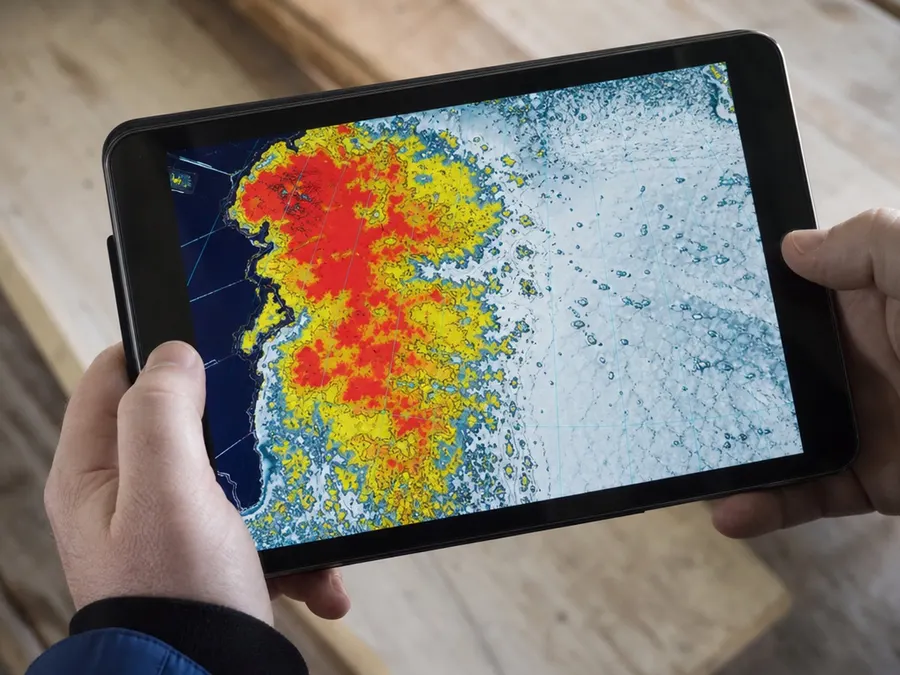
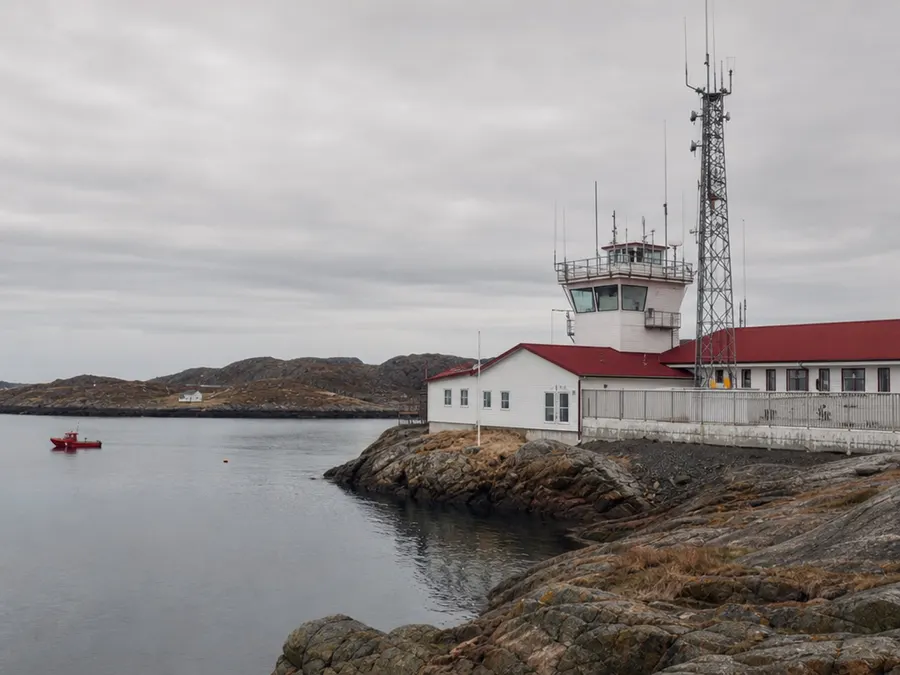
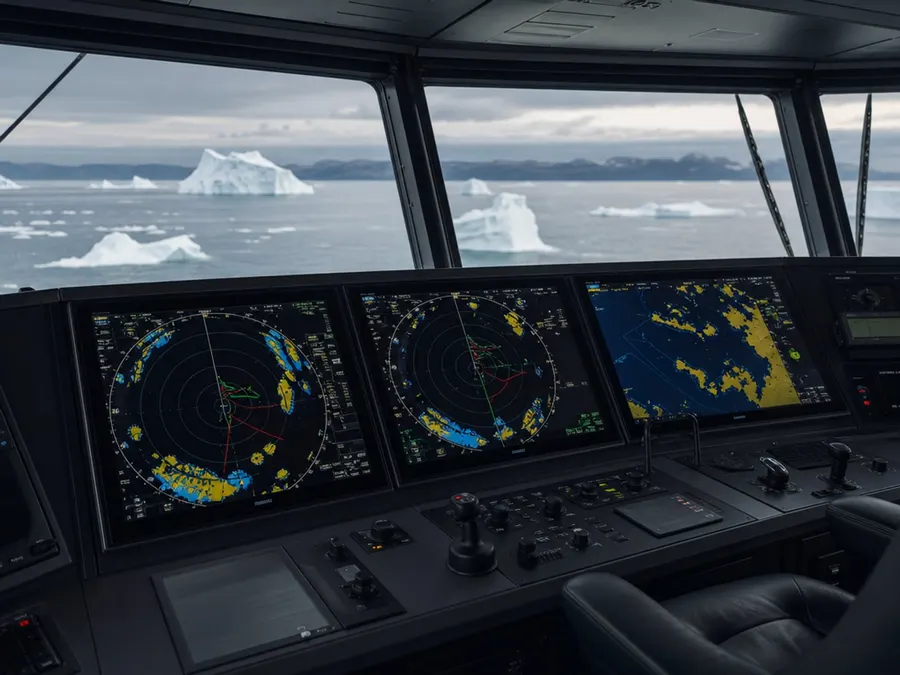
When evaluating local ice conditions in a story, it is helpful to distinguish between different types of ice. The USNIC provides daily marginal ice zone charts to represent ice concentration. On these charts, the marginal ice zone, which has an ice concentration up to 80%, is depicted in yellow. In contrast, pack ice represents areas with an ice concentration of 80% and greater, depicted in red.
Analyzing Ice Thickness and Concentration
Weekly ice charts provide deeper insights into the development and thickness of regional ice. The Weekly Ice Concentration chart offers a graphical representation of concentrations based on weekly analyses. Furthermore, the Weekly Stage of Development chart represents the estimated stage of development and ice thickness. These products help researchers and the public understand the physical characteristics of regional ice.

Monitoring 30-Day Ice Changes
Ice conditions near coastal communities can change significantly over the course of a month. To track these shifts, observers can consult the 30-Day Ice Change chart. This chart provides a graphical representation of the change in sea ice extent over the last 30 days. It is updated regularly to help visualize ongoing trends in regional ice coverage.
Consulting Arctic Daily Forecast Charts
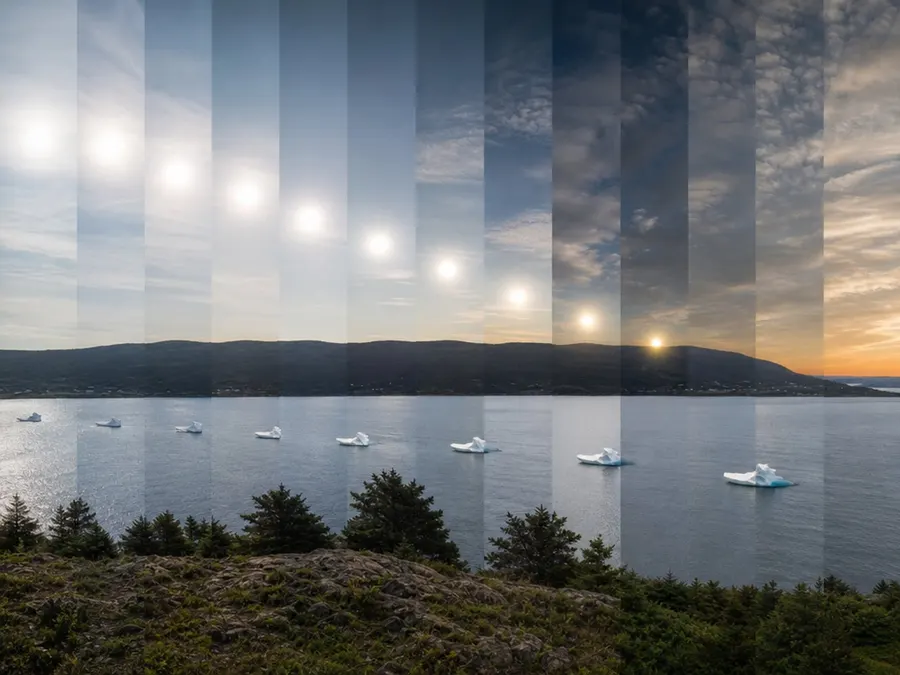
For stories taking place in the northern hemisphere, daily forecast charts provide critical predictive data. These charts depict ice-free areas in white, the marginal ice zone up to 80% concentration in yellow, and pack ice of 80% and greater in pink. They also display a 48-hour forecast ice edge line. This helps local communities anticipate where the ice edge will migrate next.
Verifying Regional Forecast Coverage
Daily forecast charts are tailored to specific geographical sectors to ensure accuracy. These products are created to cover the entire Arctic based on region, specifically the Atlantic and Pacific sectors. They are developed and updated daily on a regular basis. Checking these regional charts can help verify if local ice hazards are actively being forecasted.
Verifying Iceberg Presence via Official Tracking
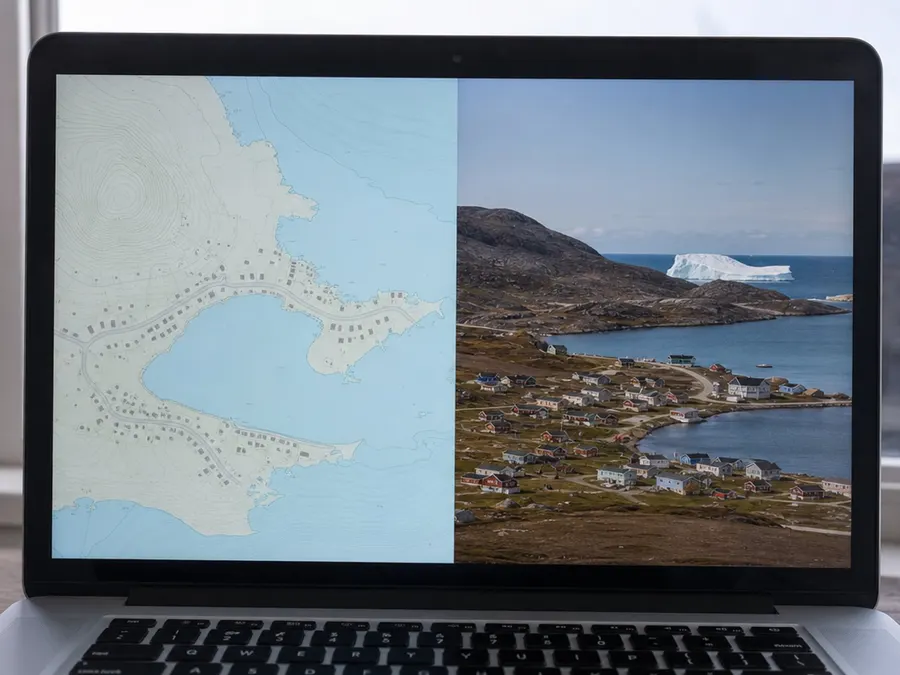
When investigating a story about a massive iceberg near a town, official tracking records can help verify its existence. Since 1978, the U.S. National Ice Center (USNIC) has routinely monitored sea ice conditions and tracked icebergs. They compile and share the latitude, longitude, and general size of icebergs seen during these routine monitors. Checking these public records can confirm if a reported iceberg has been officially documented.
Featured galleries