12 Checks Before Comparing Town Income Data
Median vs. Mean Income
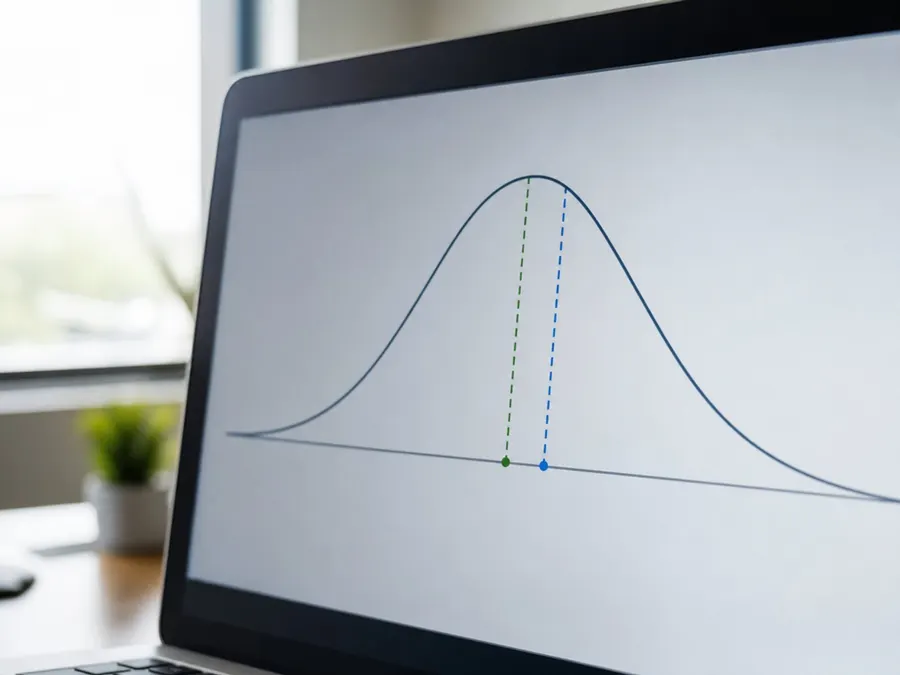
The U.S. Census Bureau publishes various tables and profiles that contain income and poverty statistics for different populations. Researchers typically consider different statistical measures, such as median or mean values, to understand local economic conditions. Depending on the metric selected from the bureau's data tools, the resulting analysis of a community's typical income may vary. Understanding these statistical options is helpful when browsing the bureau's official data tables.

Current vs. Real Dollars
The U.S. Census Bureau provides official resources, such as the 2024 comparison guidance, to help users compare American Community Survey data over time. When analyzing income trends across different years, users should consult these official guidelines to ensure comparisons are appropriate. These guidelines help account for changes in data collection and dollar values across different survey periods. Checking the bureau's specific comparison tables can prevent common analytical errors.

Survey Year and Release Date
The American Community Survey releases data profiles and comparison guidance based on specific survey years, such as the 2024 data cycle. Because data collection and publication occur on structured schedules, users must carefully identify the exact timeframes of the tables they are comparing. Comparing datasets from different years requires following the bureau's official comparison guidelines to maintain statistical validity. Verifying the release year and survey period helps ensure your comparison is reliable.
1-Year vs. 5-Year Estimates
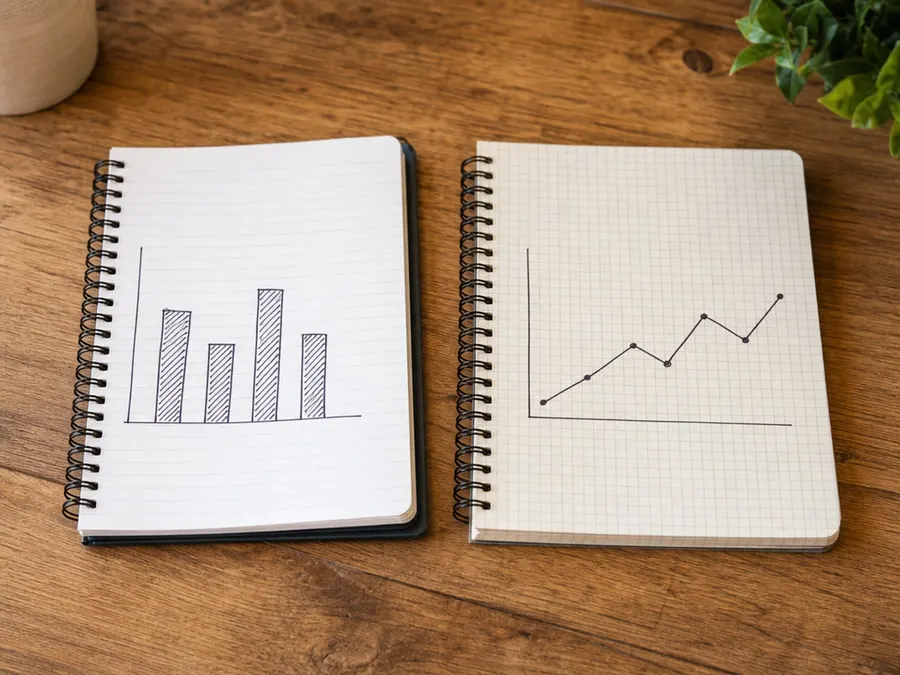
The U.S. Census Bureau offers different types of estimates through the American Community Survey to suit various research needs. Users can access multiple data products, including data profiles and comparison guides, to evaluate different geographic areas. When comparing communities, it is important to select the appropriate estimate type recommended in the bureau's official guidance. Consulting these resources helps researchers understand how different survey estimates should be compared.
Geography Definitions
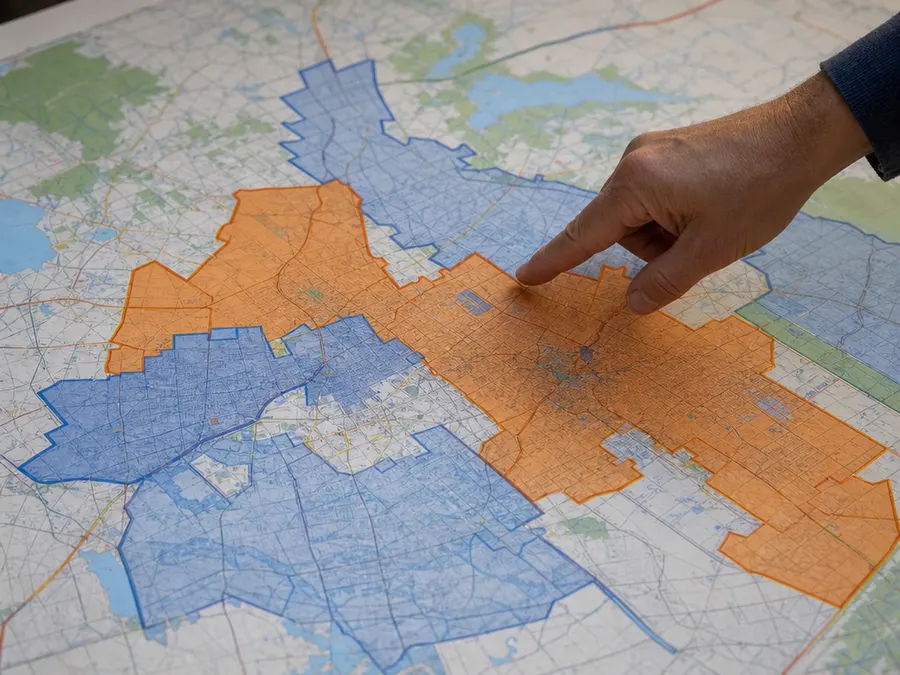
The U.S. Census Bureau provides data profiles for a wide range of geographic areas across the nation. Because geographic boundaries and classifications can vary, users should verify the specific geographic definitions used in the bureau's tables. The bureau offers geographic comparison tables and tools to help researchers compare different areas accurately. Understanding these official geographic designations is essential for conducting a valid comparison.

Population Thresholds
The availability of certain American Community Survey data products can depend on the characteristics of the geographic areas being studied. The U.S. Census Bureau provides comparison guidance to help users navigate these differences across various municipal sizes. When comparing different communities, researchers should review the bureau's guidance to determine which tables are comparable. This helps ensure that the chosen datasets are statistically compatible for your analysis.
Margins of Error
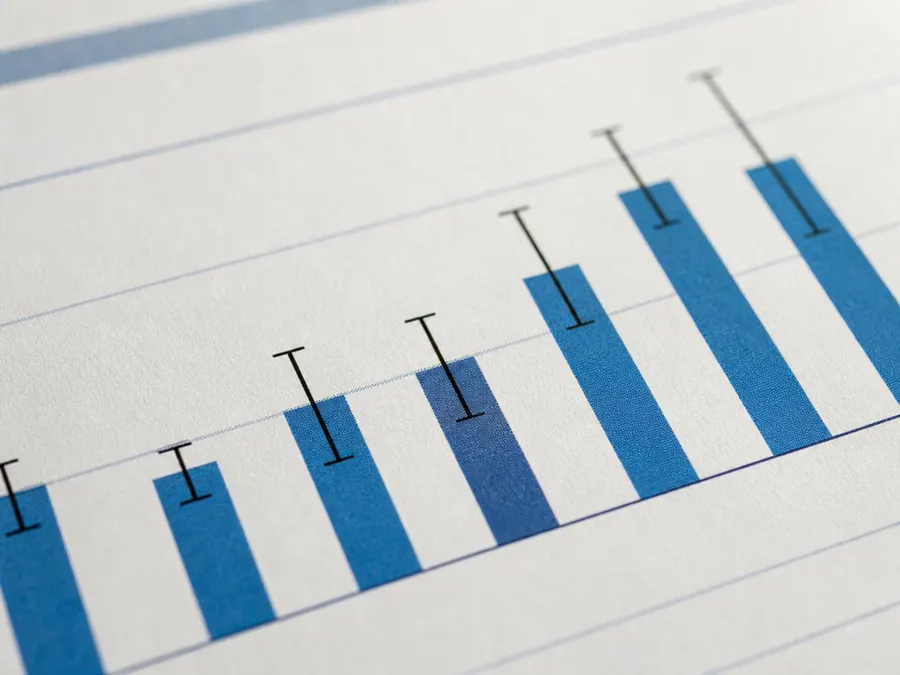
American Community Survey estimates are subject to statistical variability, which users must consider during analysis. The U.S. Census Bureau provides comparison guidance to help researchers determine if differences between areas are statistically meaningful. Consulting these official guidelines is a key step when evaluating income and poverty data across different towns. This practice helps prevent drawing unsupported conclusions from overlapping estimate ranges.

Sampling Variation
The American Community Survey collects data from a sample of the population to produce its official estimates. Because of sampling methods, some estimates may exhibit higher variability than others, particularly in less populated areas. The U.S. Census Bureau publishes comparison guidance to assist users in interpreting these variations safely. Reviewing these official instructions helps researchers evaluate the reliability of the data before making comparisons.

Boundary Changes
Geographic boundaries of analyzed areas can change over time due to local administrative adjustments. The U.S. Census Bureau provides guidance on comparing ACS data to help users account for these potential geographic shifts across different years. When performing longitudinal comparisons, it is important to check the bureau's notes on boundary changes to ensure consistency. Following these official recommendations helps maintain the integrity of your multi-year analysis.

Inflation and Comparisons
Comparing financial estimates across different years requires careful adherence to statistical standards. The U.S. Census Bureau publishes specific comparison guidance to help users evaluate changes in American Community Survey data over time. This official documentation outlines the appropriate methods for comparing income statistics across different survey periods. Utilizing these guidelines helps ensure that your multi-year economic comparisons are statistically sound.

Housing-Cost Context
The U.S. Census Bureau offers a wide range of data profiles that cover both housing and income characteristics. When evaluating a community's economic status, examining housing data alongside income data can provide a more comprehensive picture. The bureau provides tools such as geographic comparison tables and specific table IDs to help users locate and analyze these related metrics. Documenting these specific tables and your retrieval dates is a recommended practice for research validity.

Household vs. Per-Capita Income
The U.S. Census Bureau provides diverse data products, including data profiles that cover various demographic and economic topics. When comparing different geographic areas, users often examine distinct metrics such as household income or individual income characteristics. These different measures can offer contrasting perspectives on a community's economic profile depending on how households are structured. Evaluating which specific profile table to use is a key step when analyzing local areas.
Featured galleries